
How to measure success in public sector service design


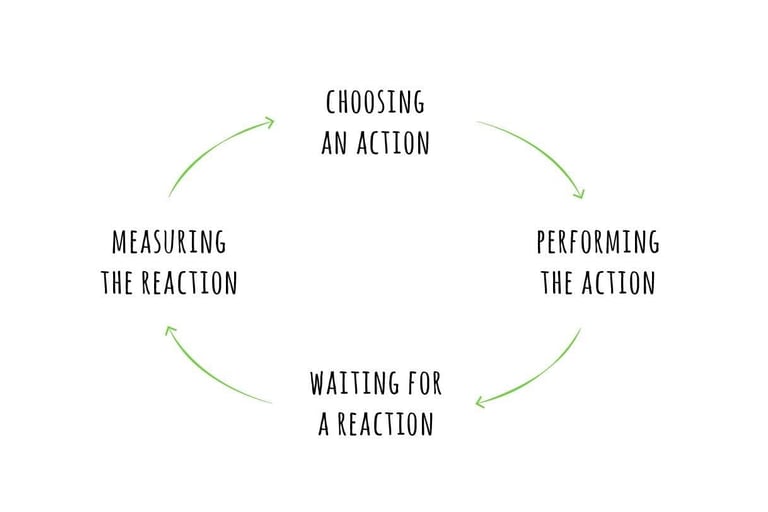
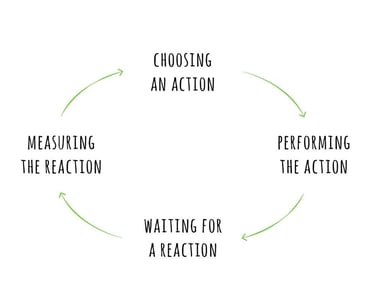
Measurement is most effective when it is built into the service lifecycle, not added at the end. This can be achieved by ensuring that:
During Discovery, teams identify what success looks like based on user needs
In Alpha, they test different ways of meeting those needs and measure early signals
In Beta, they refine the service based on real usage data
In Live, they continue to monitor and improve
Teams then move back and forth between these stages as new information emerges. Measurement evolves alongside the service. That kind of non-linear progression describes what it means to do service design in UK government, using lifecycle models as a structure even though they rarely capture how work unfolds in reality.
Common questions about measuring success
How do you measure success when data is fragmented?
Start by connecting what is available. Even if data sits in different systems, you can often align it around key points in the user journey. Mapping helps identify where those connections exist.
What if you can’t measure everything?
You don’t need to. Focus on the most important user needs and the points in the service where failure has the greatest impact. Partial visibility is still useful if it is interpreted carefully.
How do you deal with conflicting metrics?
Make the trade-offs explicit. Instead of trying to optimise everything, decide what matters most in a given context and explain why.
What if success depends on policy, not just design?
This is common. Measurement should highlight where policy constraints affect outcomes.
What effective measurement looks like in practice
When measurement is working well, you start to see:
Metrics linked clearly to user needs
Data used in conversations, not just reports
Teams aligning around shared definitions of success
Evidence informing decisions across disciplines
Continuous updates based on new insights
Measurement connects what users experience with what teams do, and helps ensure that improvements are grounded in evidence rather than assumption.
Keep it realistic
There is no perfect way to measure success in public sector services. The complexity of the environment, the number of variables involved, and the limits of available data all mean that measurement will always be imperfect.
What matters is usefulness. Metrics should help teams understand what is happening, make better decisions, and improve the service over time. When used in this way, measurement becomes less about proving success and more about continuously learning what works and what doesn’t.
Measuring success in public sector service design is not a straightforward exercise, and treating it like one is where many teams go wrong. Services span across multiple departments. That means success is not contained in one place. It is distributed across a journey that users experience as one service, but that organisations deliver in parts.
A user might start a process online, call for help when they get stuck, and trigger back-office work handled somewhere else entirely.
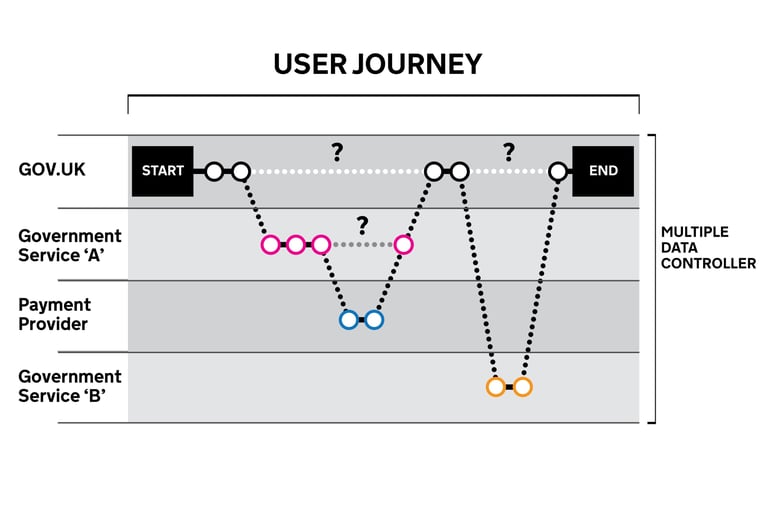
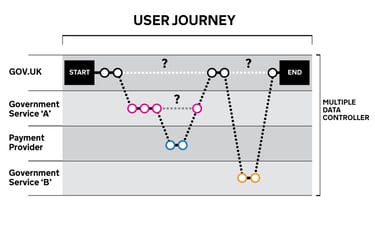
Each of these touchpoints can be measured, but none of them on their own reflect whether the service is working. What looks like a single interaction is often made up of multiple connected parts, a dynamic that's very present when you look at how government services are designed behind the scenes, with different systems, teams, and processes contributing to the overall experience.
There’s also no single definition of success. Policy teams may focus on compliance and eligibility, operations may focus on efficiency and throughput, while digital teams may track completion rates and usability. These perspectives are all valid, but they don’t always align. Measuring success means reconciling these views into something that reflects the full service, not just individual components.
Start with outcomes, not outputs
It’s easy to count how many forms were submitted, how many users visited a page, or how many transactions were completed. But these numbers don’t tell you whether the service actually worked for the user.
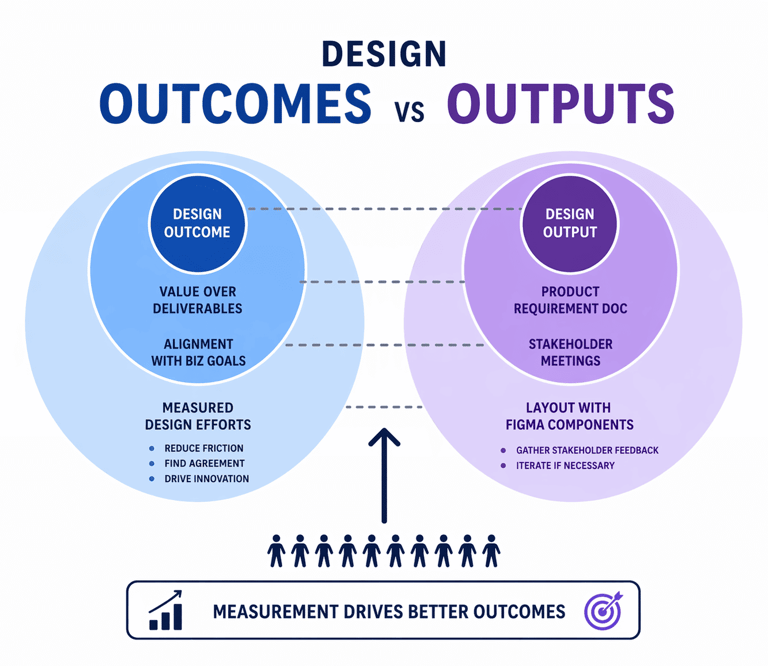
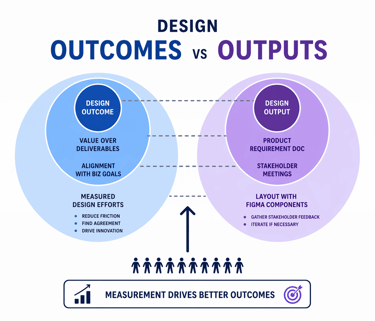
A service can have a high completion rate and still be failing because users might be completing a process they don’t fully understand or they might be making errors that require correction later.
A more meaningful approach is to focus on outcomes:
Did the user achieve what they set out to do?
Did they understand what was required?
Did they complete the process without unnecessary effort or confusion?
These questions are harder to answer, but they align more closely with the purpose of the service.
This ability to shift from outputs to outcomes is a key part of what service design actually means in the public sector.
Connect metrics to user needs
Without connecting metrics to user needs, data becomes abstract and open to misinterpretation. A drop in completion rates could indicate a usability issue, a policy change, or a shift in user behaviour. Without context, it’s difficult to know what action to take.
User needs provide that context:
If a user needs to know whether they are eligible before starting, then early drop-off becomes meaningful
If a user needs to complete a process without repeating information, then duplicate data entry becomes a signal of failure
If a user needs reassurance during a complex process, then increased contact volumes may indicate a gap in communication
This is where understanding how user needs shape government services becomes critical in practice, because it connects what users are trying to do with how success is measured.
Use a mix of quantitative and qualitative evidence
Relying on a single source of data is one of the quickest ways to misread performance. Quantitative metrics show patterns, but they rarely explain them while qualitative insights provide depth, but may not represent the full picture. Measuring success requires combining both.
For example, imagine a service where completion rates are stable, but call volumes are increasing. On paper, nothing appears to have changed but call logs might show that users are confused about a specific step. User research might reveal that a new guidance is unclear or that operational teams may highlight that cases are taking longer to process due to missing information.
Together, they tell a clearer story. This kind of cross-source understanding is closer to how decisions are shaped in reality, bringing together multiple inputs instead of relying on a single dataset.
Measure across the end-to-end service
One of the biggest challenges you’ll encounter in public sector measurement is fragmentation. Different teams track different metrics, often using separate systems. This leads to a situation where success is measured locally rather than across the full journey.
For example, a digital team might improve completion rates for an online form. At the same time, a contact centre might see an increase in calls from users who are confused about what happens next. Meanwhile, a back-office team might experience delays due to incomplete or incorrect submissions.
Each team is measuring something valid but without connecting these metrics, it’s difficult to understand the overall impact. This is why end-to-end visibility matters, and why approaches to mapping complex government services across departments are often needed to connect data to the full service journey.
Real example: measuring success in a passport renewal service
Consider a passport renewal service. On the surface, success might be measured by how many applications are completed online. But that only captures one part of the experience.
A more complete view might include:
Completion rates for online applications
Time taken to complete the application
Number of users who abandon and return later
Volume of calls related to application status
Processing times in the back office
Number of applications rejected due to errors
Looking at these together reveals a more nuanced picture. A high completion rate might be offset by a high number of errors, leading to delays in processing. Or increased call volumes may indicate that users don’t understand what happens after submission and have to call in for updates. These examples show that success is not a single metric but a combination of signals that need to be interpreted together.
Deal with trade-offs and conflicting metrics
In public sector services, improving one metric can make another worse. Simplifying a process might reduce user effort but increase the risk of errors or fraud, adding verification steps might improve compliance but reduce completion rates, or speeding up delivery might mean working within existing constraints rather than addressing underlying issues.
These trade-offs are usually part of everyday decision-making. Measurement helps make them visible, but it does not resolve them. Teams still need to decide what to prioritise and why. This tension is just one of the many challenges of designing services in the public sector.
Make success measurable but not oversimplified
There is always a temptation to reduce success to a small set of simple metrics. While this makes reporting easier, it can hide important complexity. A single “success rate” or “performance score” rarely captures the full picture.
Instead, it’s more useful to define a small set of complementary measures that reflect different aspects of the service. These might include:
User success (can users complete what they need to do?)
User effort (how hard is it to complete the task?)
Operational efficiency (how quickly and accurately is work processed?)
Service reliability (does the service work consistently across channels?)
The goal is not to track everything, but to capture enough to understand how the service is performing from multiple perspectives.
Build measurement into the lifecycle
Let's chat about your next design project.
Phone
kolawale.design@gmail.com
07826 451774
© 2025. All rights reserved.
Social